Your ERMI Score is one number. Your elevated species reveal the moisture pattern.
A custom 30+ page interpretation of your ERMI lab results. Every species ranked, with your climate zone and building characteristics factored in. A plain-language read of the moisture pattern, delivered to your inbox in minutes.
$59 one location · $108 two · $147 three, save up to $30

The ERMI Score problem
Two different moisture problems can produce the same ERMI Score.
The ERMI score collapses 36 species into one number. By design. The score alone can mask very different underlying problems. One species elevated 50× returns the same number as five species each at 10×. The first could point to a localized water source; the second to chronic humidity across the building. The number is the same; the problems aren't.
The ExplainmyERMI report tells those two problems apart. You see which species are elevated, what kind of moisture each one needs to grow, and how the 36 species correlate with your climate and the building you described.
No kits. No supplements. No funnel.
Most ERMI interpretation services have an incentive to make your results sound serious.
Many companies that interpret ERMI results also sell the test kits, supplements, remediation referrals, or coaching that come next. The more concerning your report sounds, the more of their other products you're likely to buy. That's a real conflict of interest, and most customers don't know it could be shaping the interpretation they're paying for.
We work differently. We don't sell test kits. We don't sell supplements or remediation. We have no financial reason to make your results sound worse than they are. The lab data you already have gets the same honest read no matter what it shows.
The solution
Shining light on the darkness.
Dealing with mold is hard. The ERMI lab report (a list of species names, concentrations, and a single composite score) doesn't make understanding it any easier. ExplainmyERMI is the bridge between the lab results and your next steps.
- 01Orientation
The 4 Groups
Your sample's overall ExplainmyERMI classification. The headline read on where you stand, and the orientation point for everything that follows.
- 02Pattern
The Moisture Ladder
How the species are distributed by water requirement, the shape of the moisture problem, not just its size.
- 03Context
Connecting the dots
Your full species mix, read against your specific climate and building, pointing to the conditions and areas most worth a closer look.
- 04Reference
The Species
A full reference page for each of the 36 species. Water needs, growth conditions, mycotoxin profile, and a research-grounded summary.
The 4 Groups
Every sample lands in one of four Groups.
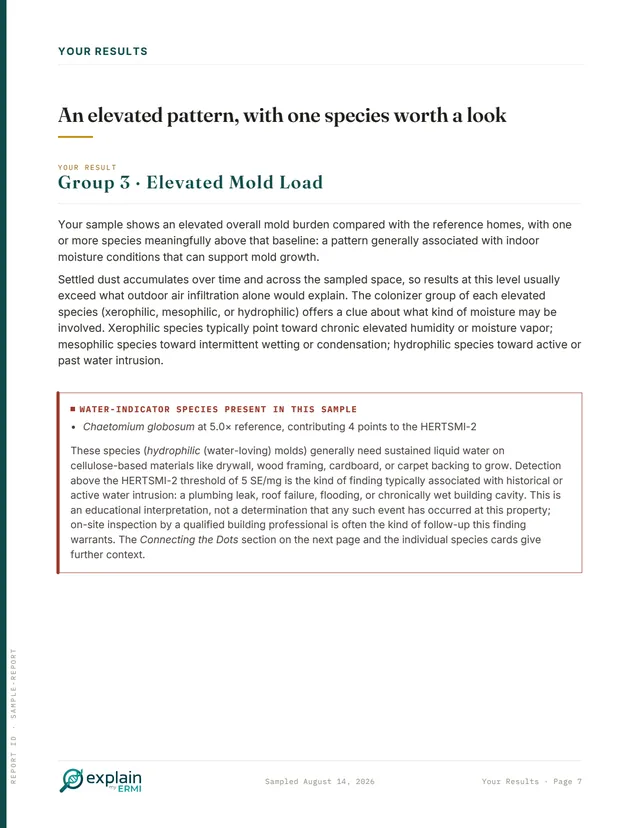
The first thing your report tells you is which of four Groups your sample falls into, from Low to High Mold Load. The Group reads the pattern across the whole panel against national reference values. It is not the ERMI score split into four ranges.
Group 1
Low Mold Load
A low overall mold burden compared with the reference homes. One species can still stand well above its reference, and the report flags it on its own card.
→ Localized issues, sensitivities, or species not on the ERMI panel may still apply. Review HERTSMI-2 and individual results.
Group 2
Average Mold Load
An average overall mold burden compared with the reference homes. It is the hardest Group to read from the label alone, because it runs from unremarkable samples to samples with one species well above its reference.
→ Pay close attention to which colonizer category the elevated species belong to and to the HERTSMI-2 score.
Group 3
Elevated Mold Load
An elevated overall mold burden, with one or more species meaningfully above the reference. This is generally associated with indoor moisture conditions that can support mold growth.
→ The colonizer category of each elevated species offers a clue: xerophilic toward humidity, mesophilic toward condensation, hydrophilic toward water intrusion.
Group 4
High Mold Load
A high overall mold burden compared with the reference homes. Results at this level usually exceed what outdoor air infiltration alone would explain.
→ Whether the dominant species are xerophilic or hydrophilic shapes what's worth investigating first. Worth reviewing with a qualified building professional.
A sample excerpt
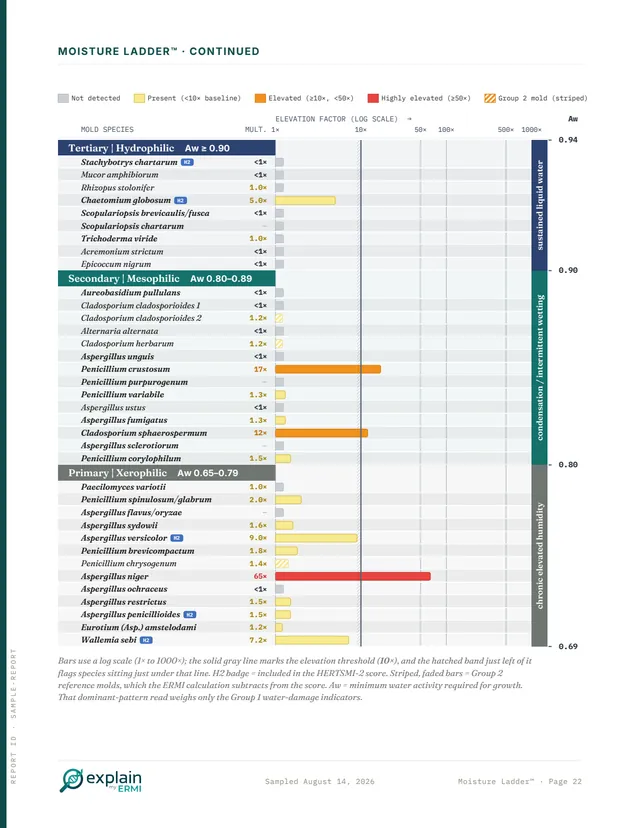
The Moisture Ladder™ shows you the picture at a glance.
All 36 species ordered from highest moisture requirement (top, hydrophilic) to lowest (bottom, xerophilic). Where the elevated bars cluster tells you what kind of moisture problem you're looking at, liquid water, condensation, or chronic humidity.
See where every species in your sample falls on the Moisture Ladder. Order your report, $59 →
What we do with that pattern
Connecting the dots from your sample.
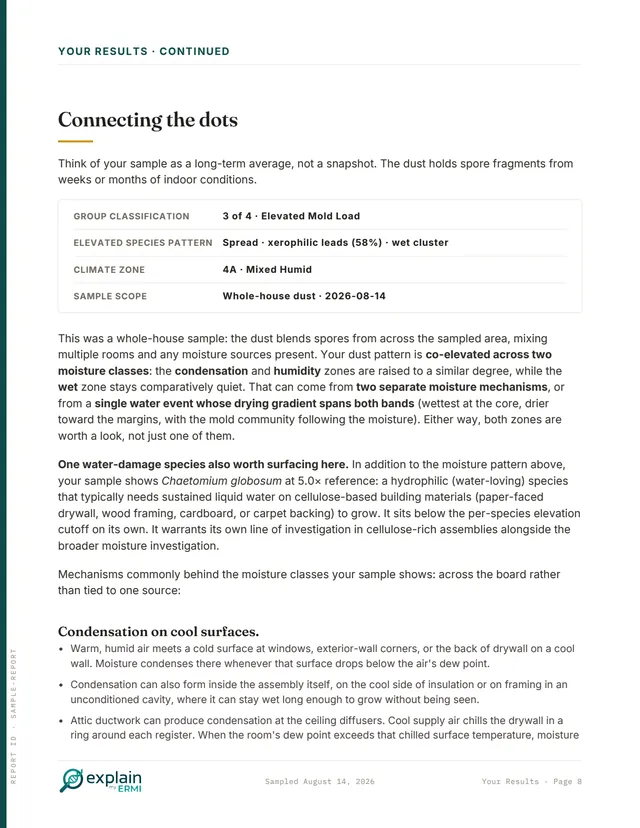
This section of the report does the interpretation work. For each sample, we integrate your ExplainmyERMI Group, the IECC climate zone for your sample ZIP Code (US only), and your building characteristics. The output is a plain-language narrative spanning a page or two, identifying the conditions most consistent with your species mix and the moisture pathways an inspector would prioritize on a walk-through.
Your sample reads as an Elevated Mold Load, with the elevated species clustering in the hydrophilic and mesophilic bands, most consistent with persistent condensation surfaces and/or recurring liquid water exposure on cellulose materials, rather than chronic humidity alone.
Combined with your IECC 4A climate (high average dew point during the cooling season) and a slab-on-grade foundation, the most common building-side issues we'd look for first are: HVAC condensate management (drain pan, line, evaporator coil), envelope air-leakage paths producing condensation on cool interior surfaces, and any history of plumbing or appliance leaks.
The supplemental sources you noted layer additional signals on top. A wood or pellet stove used as supplemental heat commonly creates localized drying right around the stove while leaving distant rooms cooler and damper. These temperature gradients often produce condensation on cooler surfaces farther from the stove. Meanwhile, a whole-house humidifier integrated with the HVAC counteracts the normal drying effect of forced-air heating, so indoor humidity tends to follow the humidifier's set point rather than the drier baseline a forced-air home would otherwise reach in winter. None of this is a diagnosis of any specific source in your building. These are simply the most common expectations given what your sample shows and the conditions you described.
What this is. A reasoned interpretation grounded in published mycology and building-science literature, designed to reduce guesswork and help you focus your next steps. What it isn't. A diagnosis, a determination of habitability, or a substitute for an on-site inspection by a licensed mold assessor. More on how this works on our methodology page.
Species index
All 36 ERMI species, individually explained.
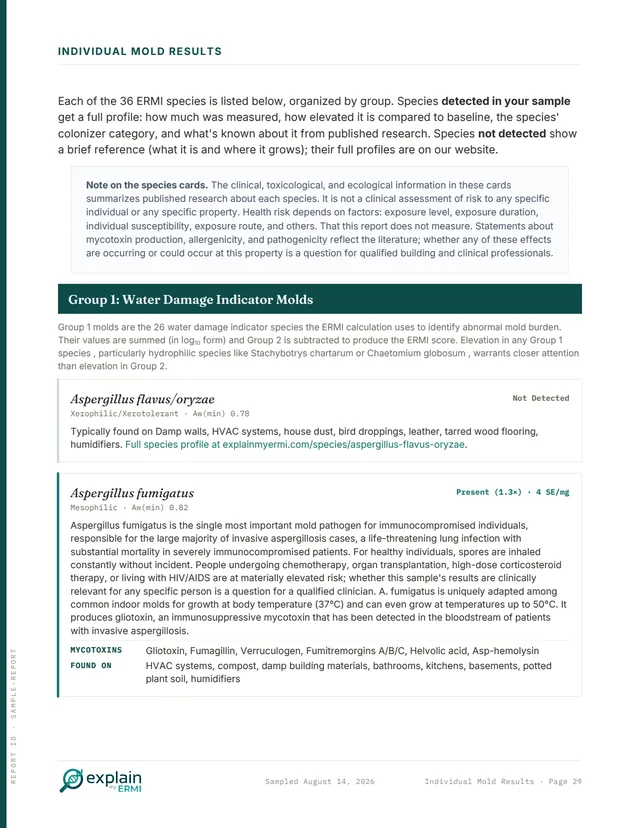
Every species in the panel has its own page covering ecology, water requirement, mycotoxin profile, building origins, and what an elevation typically means. Six examples are shown below. The full index links to all 36.
Stachybotrys chartarum
The species commonly called “black mold.” Requires sustained liquid water on cellulose: drywall, insulation paper, water-damaged wood. Elevation here is one of the most specific dust signals for active water damage.
Read full profile →Chaetomium globosum
Indicator of chronic wetting events. Often rides alongside Stachybotrys when liquid water has been on cellulose for weeks. Produces chaetoglobosins, among the more clinically relevant mycotoxins on the panel.
Read full profile →Aspergillus versicolor
The most common indoor sterigmatocystin producer. Thrives on chronic condensation surfaces: basements, exterior walls in cooling climates, persistently humid corners. Elevation often points to vapor or thermal bridging issues.
Read full profile →Aspergillus penicillioides
Grows on dust at very low water activity, humid air alone, no liquid water required. Elevation typically reflects sustained indoor relative humidity above ~60%, often without any visible water-damage event.
Read full profile →Wallemia sebi
Among the most drought-tolerant fungi known. Frequent in stored textiles, dust-rich settled environments, and salt-rich substrates. Elevation rarely points to active water damage; more often a humidity or housekeeping signal.
Read full profile →Penicillium chrysogenum
Cosmopolitan and nearly always present at low levels. Strong elevations typically reflect chronic damp organic substrates: wallpaper paste, drywall, paper-faced materials retaining moisture below visible thresholds.
Read full profile →Each page covers water-activity minima, mycotoxin profile, common building substrates, and what an elevation typically points to.
What you'll get
What we can (and can't) tell you about your sample.
ERMI tests have intrinsic limits. Every honest service has them, but most don't say so. Below: what the report addresses and what it doesn't, paired together.
Order your report
You have the numbers. Understand what they mean.
A 30+ page interpretation built around your specific lab values, your climate zone, and your building.
- Your sample placed on the four-Group ExplainmyERMI scale (Low / Average / Elevated / High Mold Load)
- Every elevated species: where it grows, mycotoxin profile, water-activity range, and what an indoor elevation typically indicates
- Moisture Ladder: where each elevated species sits on the water-activity scale, from humid air to liquid water
- Connecting the dots: how your climate, building, and elevated mold species fit together
- Plain-language interpretation with primary-source citations, written for a homeowner
$59
for a single report · one location
Order your report →Delivered to your inbox in minutes · One-time purchase · Adding a 2nd or 3rd location bundles at a discount · No upsells, no follow-on services, no account required